


This bar chart shows the amount of hours a day people played with their toys as a child. This shows that most people played with their toys for 1-3 hours a day but the results were close.

This bar chart shows the amount of hours people play with their toys now. The results show that most people play with their toys 1-3 hours a day which is the same as when they were a child.

This bar chart shows how many people use their mobile phones as a source of games. The results show that most people do. This shows that gaming has reached new technologies and you can access games anywhere.

This bar chart shows which kind of games people play on their phones, this chart shows that Angry Birds for the Iphone is the most popular.

This bar chart shows that most people would let their kids play the toys that they played with when they were younger. This shows that most people think that their toys were appropriate for kids and not violent as some people do think that video games are too violent.


This bar chart shows that most people that answered our questionnaire prefer newer games to older games. This is important to our research as we now know that in our documentary we should focus more on newer toys rather than older toys.

In this bar chart, it shows that most people agree that video games aren't too violent.This is interesting because in the media (the news and newspapers etc) it seems that most people believe that video games are too violent with people recreating violent parts of certain games, but our research disagrees.

This bar chart shows that most peoples parents bought them games which were over 18 when they were younger. This shows that people have been exposed to violent/inappropriate games from a young age.

Most people thought that the Xbox 360 was the most popular game from last year as you can see from this bar chart. These people were right as this was the best selling item on this list from last year.
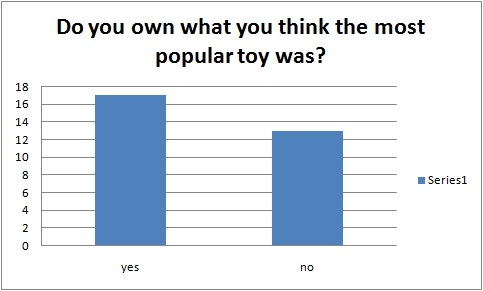
This bar chart shows that most people did own what they thought the most popular selling toy for teenagers last year.

This bar chart shows that most people when they were younger played with their toys with their friends, this shows that older toys were more sociable and people actually went outside and played with their toys. Not just sat at home on the xbox talking to their virtual friends on their headsets.

This bar chart shows that most people think that modern gaming is more sociable than older games. This could be due to the internet and people can chat online with their games and now, most games require more than one player to play.
No comments:
Post a Comment